
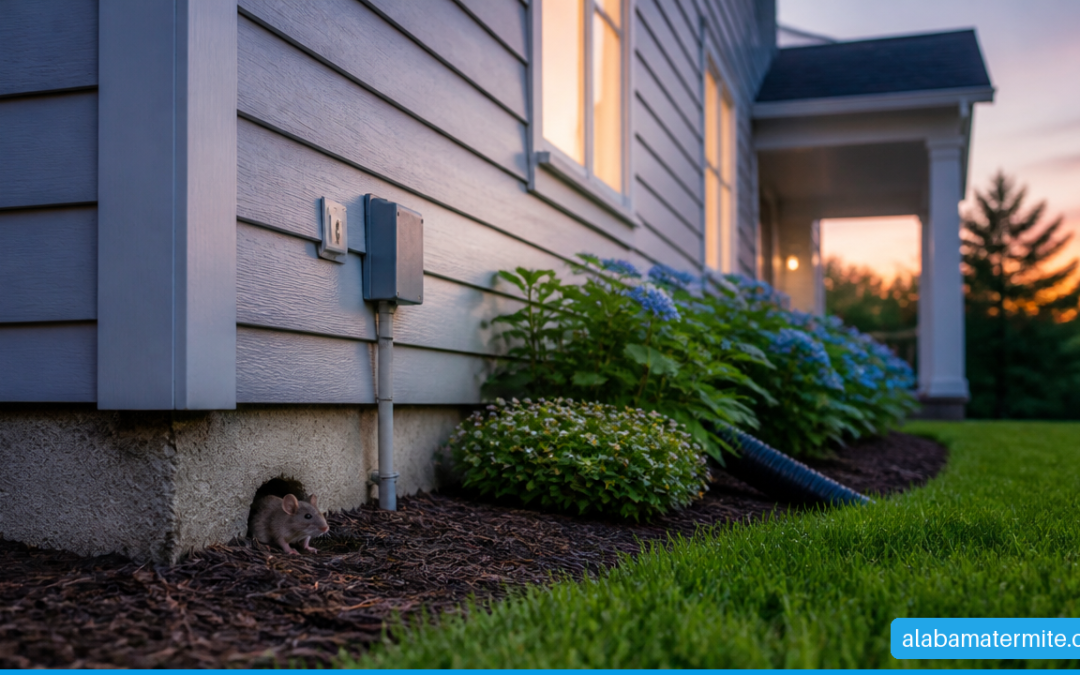

What state has the worst mice problem? There is no single authoritative, mouse-only ranking for all 50 states. The most honest answer depends on what is being measured. Pennsylvania is a strong candidate when the focus is the share of homes with mouse evidence, largely because of Philadelphia. New York is a leading candidate when the focus is overall urban rodent pressure and pest-control demand, centered on New York City.
That distinction matters. A state can have one severe urban hotspot without having the highest statewide mouse prevalence. Another state may have more affected homes as a percentage of households, even if it has fewer total infestations. Before naming a winner, we need to look at the measuring stick.
Table Of Contents
- Key Takeaways
- Why Pennsylvania And New York Lead The Discussion
- What A Fair State Comparison Would Measure
- Why Some Areas Have More Mouse Pressure
- How To Respond To A Mouse Problem At Home
- Frequently Asked Questions
Key Takeaways
• Pennsylvania is a leading answer for household mouse evidence. Philadelphia has repeatedly appeared near the top of analyses measuring homes with signs of mice.
• New York is a leading answer for broad urban rodent burden. New York City often ranks highly in commercial rodent-service lists, but these rankings include rats and reflect service demand rather than a census of mice.
• Boston had the highest percentage in one recent metro comparison. That result was for homes with signs of mice or rats, not mice alone, and it cannot be used to declare Massachusetts the worst state.
• Raw totals and household percentages answer different questions. Large states and large cities can dominate total counts simply because more people and housing units are present.
• A mouse-only statewide prevalence dataset is still missing. Without one consistent method across all states, a definitive national winner would overstate what the available data can prove.
A useful rule: treat city rankings as evidence of a local hotspot, not automatic proof that the entire state has the nation’s worst mouse problem.
Why Pennsylvania And New York Lead The Discussion
Pennsylvania Is Strongest On Household Mouse Evidence
If we define “worst” as the greatest share of homes with mouse evidence, Pennsylvania has a credible case. Philadelphia is the main reason. A Bloomberg analysis summarized by The Fiscal Times reported that nearly 20% of Philadelphia homes showed evidence of mice in the cited analysis.
That number is meaningful because it focuses on homes, not simply the total number of rodents reported. In practical terms, a household-evidence measure asks: out of every 100 homes examined or represented in the data, how many had signs that mice were present? Signs can include droppings, gnaw marks, nesting material, or sightings.
Still, Philadelphia is not Pennsylvania. The city’s older housing stock, density, transportation corridors, restaurant activity, multifamily buildings, and seasonal indoor shelter demand can create conditions that differ sharply from rural counties or smaller cities elsewhere in the state.
A homeowner in a Philadelphia row house and a homeowner in a lightly populated northern Pennsylvania community may both live in the same state, yet face very different mouse risk. That is why a city statistic should be treated as a warning about a metro area, not a statewide diagnosis.
New York Leads Many Overall Rodent Rankings
New York becomes the leading answer when the question shifts from mouse prevalence to overall urban rodent pressure. In a Terminix-based city ranking covered by Yahoo News, New York City ranked first for overall rodent infestation, followed by Los Angeles and Philadelphia.
That ranking is useful, but its limits are important. Terminix rankings are based on demand for the company’s rodent services in markets it covers. A service-demand list can reveal where people are seeking treatment, but it cannot directly count every mouse in homes, sewers, alleys, parks, warehouses, or vacant buildings.
Service demand is shaped by several factors:
• How many households and businesses are located in the market
• Whether residents can identify signs of rodents and seek professional help
• The company’s local coverage and customer base
• Property-management practices and building inspection rules
• Whether rats, mice, and other rodent issues are grouped together
New York City’s first-place position therefore supports the conclusion that it has intense urban rodent pressure. It does not prove that New York State has the highest mouse population density or the highest percentage of homes with mice.
California Belongs In The Conversation, Too
California is often mentioned because Los Angeles, San Francisco, Sacramento, and other cities appear in rodent and mouse discussions. A-Z Animals identifies California, New York, and Pennsylvania as states repeatedly associated with substantial mouse or rodent problems, particularly around major population centers.
California’s size complicates the picture. It has many climates, housing types, and urban forms. Coastal neighborhoods, inland suburbs, agricultural edges, dense downtown districts, and wildfire-affected areas do not face the same rodent conditions. A large number of service calls in Los Angeles cannot tell us what mouse prevalence looks like across the entire state.
The broader pattern is clear: states with large, dense metros appear often in rankings. The less clear question is whether they have the worst statewide mouse problem after adjusting for households, reporting practices, and rats versus mice.
What A Fair State Comparison Would Measure
The Metric Changes The Winner
The phrase “worst mice problem” sounds simple, but it can mean several different things. Each measurement answers a valid question. Problems start when a ranking built for one question is used to answer another.
| Measurement | What It Tells Us | Main Limitation | Likely Effect On Rankings |
|---|---|---|---|
| Total reported infestations | Where the largest number of cases occurs | Favors populous states | New York and California may rise |
| Affected-home percentage | How common mouse evidence is among homes | Requires consistent household sampling | Smaller states or metros may rise |
| Pest-control service demand | Where customers seek professional rodent help | Influenced by company coverage and consumer behavior | Major service markets may rise |
| Sightings or complaints | Where rodents are noticed and reported | Reporting systems vary widely | Cities with active reporting may rise |
| Combined pest score | Broad household pest burden | May mix mice, rats, and cockroaches | Cannot answer a mouse-only question |
A fair national comparison would use one mouse-only definition, the same data-collection period, and a consistent denominator. Ideally, it would estimate the percentage of occupied homes in every state with confirmed mouse evidence over the same period.
That kind of dataset would also need to explain how it handles apartments, vacant homes, seasonal residences, commercial properties, and rural areas. Without those controls, the state with the most reports may simply be the state with the most people, the most available pest-control services, or the most complete complaint records.
Boston Shows Why Metro Results Must Be Handled Carefully
A 2023 comparison summarized by ConsumerAffairs listed Boston at 25% of homes with signs of mice or rats. Philadelphia was listed at 20%, New York City at 17%, and Cleveland and Cincinnati at 13%.
At first glance, that might make Massachusetts seem like the obvious answer. But the comparison is metro-based and combines mice with rats. It does not show a mouse-only rate for every Massachusetts household, nor does it compare every state using the same statewide sample.
Consider two hypothetical states. State A has one metro where 25% of homes show mouse or rat signs, but most of the state is rural and has lower rates. State B has several cities where 15% to 18% of homes show mouse evidence. State A may look worse in a city ranking, while State B may have the broader statewide issue. Both answers can be true depending on the denominator.
Why Combined Pest Data Can Mislead
Mice, rats, and cockroaches often share food sources, shelter, moisture, and dense housing conditions. That makes combined-pest reports useful for identifying broad housing or sanitation pressures. They are not precise enough to answer a mouse-only question.
Rats and mice differ in behavior, body size, movement patterns, and control needs. A property with roof rats may require tree trimming and exclusion at upper rooflines. A house mouse problem may begin with a gap around a utility pipe, a pantry spill, or a cluttered garage. Combining them into one score can hide these important differences.
For readers trying to compare states, the practical takeaway is simple: check the label on the data before trusting the ranking. If it says rodents, it may include rats. If it says pests, it may include cockroaches. If it says service calls, it measures demand rather than direct prevalence.
Why Some Areas Have More Mouse Pressure
Density Creates Opportunity, Not Destiny
Population density does not create mice by itself. What density creates is a concentrated supply of food, shelter, waste, warmth, and connected structures. In a row of attached homes or apartment buildings, mice can move through wall voids, utility lines, basements, shared trash areas, and gaps around plumbing.
Dense neighborhoods also make a local control failure easier to spread. If one building has an open dumpster, poorly sealed loading door, or unmanaged clutter, nearby properties can see pressure increase. The issue becomes less about one kitchen and more about a connected environment.
But density is not destiny. A well-maintained multifamily property with sealed utility penetrations, clean waste areas, regular inspections, and prompt repairs can have less rodent activity than a poorly maintained rural home near fields, woods, or stored animal feed.
Climate And Seasonal Shelter Drive Indoor Activity
Mice can live outdoors, but homes become especially attractive when outdoor food declines or temperatures become uncomfortable. Fall and winter often bring more visible indoor activity because mice seek stable shelter and accessible food.
In colder regions, this pattern can be dramatic. In warm and humid regions, mouse pressure may continue through more of the year, especially where vegetation, crawlspaces, outdoor storage, pet food, bird seed, and moisture provide ongoing resources.
Seasonality also changes how people interpret rankings. A city measured during a cold-weather surge can appear worse than one measured during a quieter period. A reliable comparison needs the same season or a full year of data across every location.
Housing Conditions Matter More Than State Lines
State boundaries do not stop mice. Buildings do. A gap the width of a pencil can be enough for a house mouse to enter, and once inside, it can use wall cavities and insulation as protected travel routes.
Common property conditions that raise risk include:
• Open gaps around pipes, cables, vents, and doors
• Damaged weatherstripping or door sweeps
• Food stored in thin bags, open bins, or cluttered pantries
• Pet food left out overnight
• Overflowing garbage or outdoor feeding areas
• Firewood, boxes, vegetation, or stored materials close to the structure
• Moisture problems in basements, crawlspaces, kitchens, or utility rooms
These conditions explain why two homes on the same block can have very different outcomes. Mouse pressure is regional, but infestation is often decided at the building level.

How To Respond To A Mouse Problem At Home
Start With Evidence, Not Guesswork
If you suspect mice, begin by identifying where activity is happening and what is drawing them inside. Droppings in a pantry, gnawing under a sink, shredded insulation in a garage, or scratching in a wall each points to a different travel route or nesting area.
A simple inspection workflow is more effective than placing traps at random:
- Check kitchens, pantries, laundry rooms, garages, attics, basements, crawlspaces, and utility areas for signs.
- Look outside for entry points around pipes, vents, siding transitions, garage doors, crawlspace openings, and foundation gaps.
- Remove food access by using hard-sided containers, cleaning crumbs, managing pet food, and securing trash.
- Reduce hiding places near the home by moving stored materials and stacked firewood away from exterior walls.
- Use traps strategically along walls and near confirmed activity, not in the center of open rooms.
- Reinspect after control begins. Fresh droppings, new gnawing, or repeated captures suggest an unresolved entry point or nesting area.
Know When DIY Measures Are Enough
Do-it-yourself prevention may be reasonable when activity appears limited, entry points are easy to identify, and there is no sign of a large or recurring infestation. For example, a single mouse caught near a garage door after a cold front may be resolved by sealing the door gap, improving food storage, and monitoring with traps.
DIY methods are less suitable when mice are active in walls or ceilings, droppings appear in food-storage areas, multiple rooms show evidence, or the problem keeps returning after trapping. Those signs suggest that exclusion, sanitation, and monitoring need to work together.
Fair warning: traps alone can reduce the number of mice you see without solving why they entered. If an exterior gap remains open, the same cycle can restart when weather changes or food becomes scarce outdoors.
Use Professional Help For Recurring Or Complex Problems
Professional rodent control is most useful when the property has multiple entry points, a crawlspace or attic issue, an attached garage, shared walls, commercial food storage, or recurring activity after prior efforts. The goal should not be simply “put out more bait.” A sound plan identifies travel routes, excludes mice, reduces attractants, and verifies whether activity is declining.
For renters, document signs with dates and photos, protect food, and notify the property owner or manager promptly. In multifamily housing, a unit-by-unit fix may fail if rodents are moving through shared voids or common waste areas. Coordinated building-level repairs may be needed.
The same principle applies whether you live in Alabama, Pennsylvania, New York, or California: local rankings are interesting, but your home’s openings, food sources, moisture, and maintenance conditions determine your immediate risk.
Frequently Asked Questions
Which State Has The Worst Mouse Problem In The United States?
No state can be named with scientific certainty because there is no standardized, nationwide mouse-only ranking of all 50 states. Pennsylvania is a strong candidate when household mouse evidence is emphasized, while New York is a leading candidate for broad urban rodent pressure. The answer changes with the metric.
Is Pennsylvania Worse Than New York For Mice?
Pennsylvania may appear worse when comparing household mouse evidence tied to Philadelphia. New York may appear worse when using overall urban rodent-service rankings centered on New York City. Neither city-level result proves that one entire state is worse than the other.
Does Philadelphia Have More Mice Than New York City?
Available reports support different conclusions depending on the measure. Philadelphia has been associated with a high share of homes showing mouse evidence, while New York City frequently ranks higher for overall rodent activity or commercial rodent-service demand. Those are not interchangeable measures.
Which State Has The Highest Percentage Of Homes With Mouse Evidence?
A reliable all-state answer is not available from the commonly cited rankings. Some metro reports show high percentages for individual cities, but they do not provide a consistent mouse-only household percentage for every state.
Are City Rankings Reliable For Comparing States?
They are useful for identifying local hotspots, but they are not enough to rank states. A state may contain one severely affected city and many lower-pressure areas. Another may have moderate but widespread activity across several metros.
Why Do Northeastern States Appear So Often In Mouse Rankings?
Large older cities, dense housing, connected buildings, cold-weather shelter seeking, and extensive food and waste infrastructure can all contribute. These conditions are common in many Northeastern metros, but they are not unique to that region.
Do Pest-Control Rankings Measure Actual Mouse Populations?
Not directly. Commercial rankings usually measure treatments, service requests, or company activity in covered markets. They can show where rodent control demand is high, but they do not count every mouse and may include rats.
What Should I Do If My Local Conditions Conflict With A National Ranking?
Prioritize the evidence at your property. Check for entry points, food sources, droppings, nesting material, and recurring activity. A low-ranked state can still have serious local mouse problems, and a highly ranked state can contain well-protected homes with little activity.
Sources And References
- A-Z Animals — Where Do Mice Nest Outside? https://a-z-animals.com/blog/where-do-mice-nest-outside/
- ConsumerAffairs — These cities had more rats, mice and cockroaches invading homes in 2023 https://www.consumeraffairs.com/news/these-cities-had-more-rats-mice-and-cockroaches-invading-homes-in-2023-092824.html
- The Fiscal Times — Cockroaches, Rats and Mice: These Are the Country’s Most Infested Cities https://www.thefiscaltimes.com/2015/07/31/Cockroaches-Rats-and-Mice-These-Are-Country-s-Most-Infested-Cities?page=83
- Yahoo News — SF ranks high in cities with most rodents: report https://www.yahoo.com/news/us/articles/sf-ranks-high-cities-most-225404655.html